samplig rate and rasterplot #3
Description
Dear Axion developers,
We are working with your Axion biosystems multi electrode array to register neuronal activity
I extracted the timespan from the .spk with a matlab code. Then, I continued working in R.
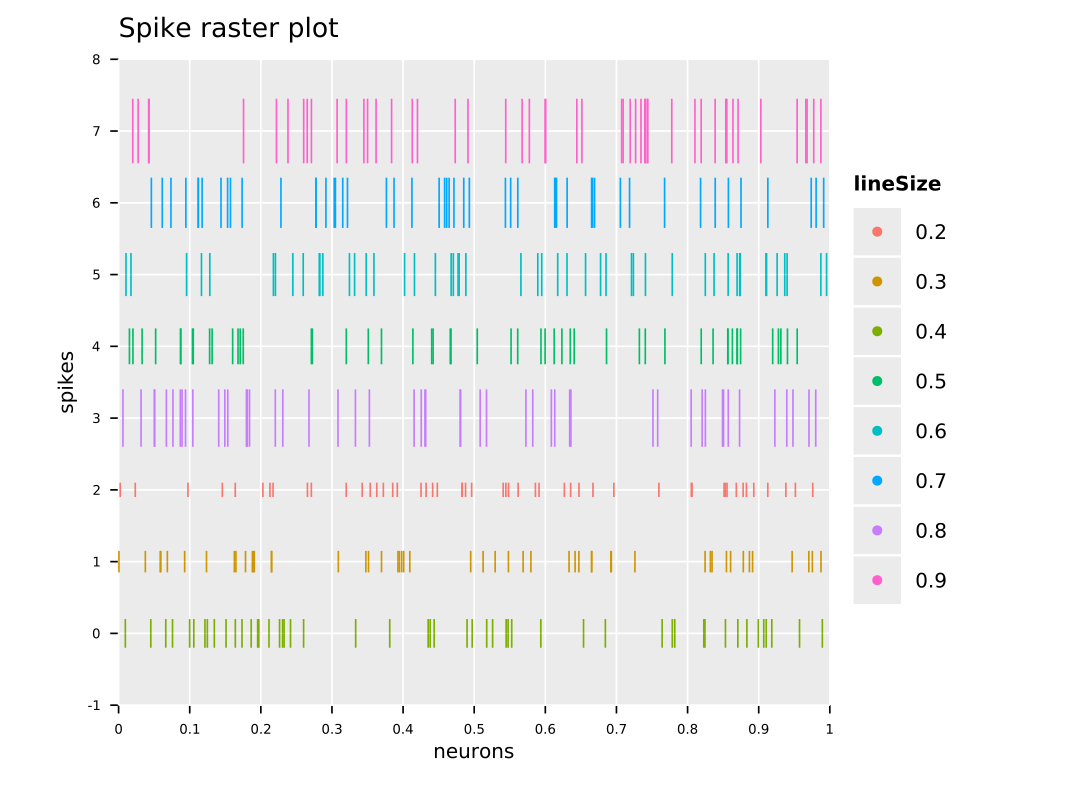
I would like to create a raster plot of spiking activity (similar to the one in the attached picture), and if I understand it correctly, for this I would need a matrix of the form number_rows=number of electrodes, number_columns=total data points recorded. In this matrix, the time points with reordered spikes would be annotated with 1, and the other time points (without spike) would be annotated with 0.
for example, for 2 electrodes and 16 registered times:
0000010001000111
0110111000011100
Since the sample rate is 12500 Hz, I thought that each recorded data point should be 1/12500 (0.00008 seconds) apart.
However, if I generate a sequenced vector (assuming it contains every recorded second) with
all_time_points<-seq(8e-05, 300, by = 8e-05), I can't get it to match the timestamp values. This means that each registered data point is not 0.00008 seconds apart from each other.
Could you please orientate me on how to generate a matrix of the form number_rows=number of electrodes, number_columns=total data points recorded, where each spike is recorded as a 1 and each time without a spike is a zero? Which would be the exact distance between each reordered data point?
Thank you veyr much for your kind help!